🎓 Definition
The Share of Space is a KPI that allows the Retailers or Manufacturers to measure the on-shelf allocation of a Category or a Brand and can be used as a measurement to compare with competitors.
There are 3 main methods Retailers or Manufacturers use to calculate the share of space:
Method 1: Count the number of facings of SKUs or for a Brand versus the total of facings in the Category or versus other Brands.
Method 2: Measure the size occupied by a segment or a brand and compare it versus the total Sub-Category or other Brands.
Method 3: Image recognition, using photographs/videos of the complete shelf and applying various algorithms, one can record the share of references of a given brand versus the total category.
🧪 Example of Share of Space
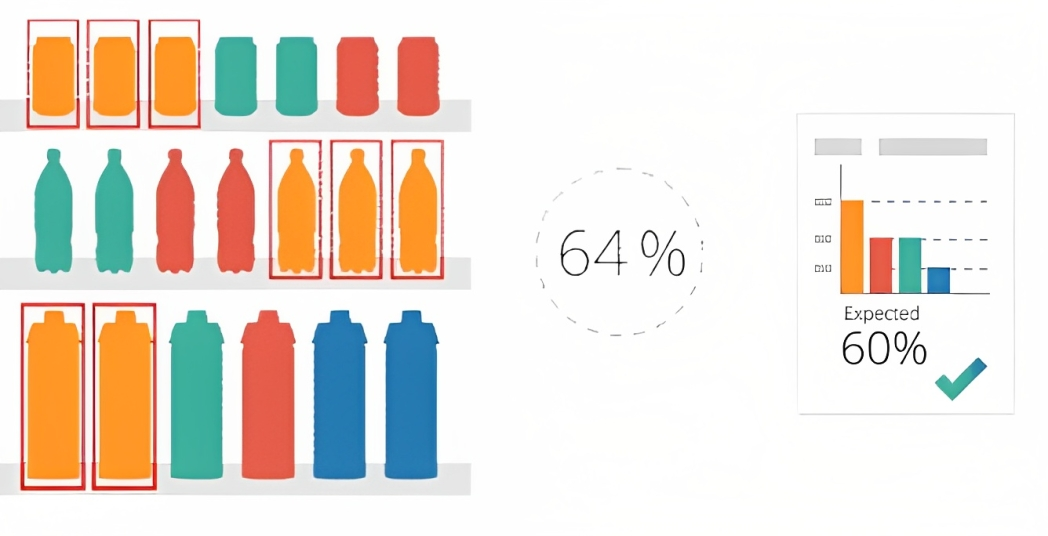
Facing count: The number of facing available in the Shampoo Category is 180:
- Brand A has 10 SKUs in Shampoo Category, and each SKU has 2 facings, the total of facing for Brand A is 20, and the share of space for Brand A is 11%. (20/180)
- Brand B has 25 SKUs in Shampoo Category, and each SKU has 3 facings, the total of facing for Brand B is 75, and the share of space for Brand B is 42% (75/180)
Space shelf measurement: This is similar to counting the facings, except this time the calculation is made based on the centimeters occupied by a Brand within a Category.
The number of developed linear meters for Biscuits is 15 meters.
- Brand E has 10 SKUs in the Biscuits category and the size occupied by the 10 SKUs is 2.50 meters, the Share of Space for Brand A is 16.5%
- Brand F has 25 SKUs in the Biscuits category and the size occupied by the 25 SKUs is 3.75 meters, the Share of Space for Brand B is 25%
❓What is Share of Space used for
The “holding space” on the shelf has a big impact on Brand or Product visibility to attract Customer’s attention and maximize purchases. Monitoring the Share of Space allows Retailers to measure the effectiveness of the on-shelf visibility of brands/categories.
Comparing shelf Share of Space to Market Share allows Retailers to evaluate whether a Manufacturers or Brands or Sub-Category is over or under-represented in a store:
- Share of Space > Market Share: well-negotiated assortment that will maximize manufacturer growth.
- Share of Space = Market Share: the most normal, “fair” situation adjusting the presence on the shelf to the importance of sales.
- Share of Space < Market Share: a dangerous situation that can lead to high out-of-stock issues.
Also comparing the Share of Space to the Share of Assortment allows Retailers to gain insight into the performance of different products and brands within their store and optimize the store layout and product placement.
- Share of Space > Share of Assortment: Category or Brands is taking up a lot of physical space within the store and not performing as well as others. Retailers may want to consider reducing the space.
- Share of Space = Share of Assortment: Category or Brands is being allocated an appropriate amount of physical space and the retailer is effectively managing the amount of space it takes up within the store.
- Share of Space < Share of Assortment: Category or Brands is performing well and not taking up much physical space, the Retailer may want to consider giving more space to increase sales.
How frequently should Retailers or Manufacturers measure the Share of Space?
It is advisable for Retailers or Manufacturers to measure the Share of Space regularly to stay updated with the changing dynamics of their product assortments and shelf layouts. While the specific frequency can vary based on factors such as product turnover rate, seasonal trends, and competitive landscape, many industry experts recommend conducting these measurements on a monthly or quarterly basis. Regular monitoring allows Retailers and Manufacturers to identify trends, make timely adjustments, and ensure optimal on-shelf visibility and product availability.
What are the challenges or limitations of using each method to calculate the Share of Space?
Each method of calculating the Share of Space has its own set of challenges and limitations.
For the facing count method, it can be time-consuming and prone to human error, especially in stores with a vast assortment of products and frequent changes in shelf layouts.
The space shelf measurement method requires accurate measurements of the physical space occupied by each product or brand, which can be challenging if the shelf configurations are complex or irregular.
Image recognition, although technologically advanced, may face challenges with accuracy and consistency due to variations in shelf lighting, product packaging, and shelf arrangement. Additionally, implementing image recognition systems can be costly and may require specialized expertise for data analysis.
How can Retailers or Manufacturers optimize their Share of Space effectively?
To optimize their Share of Space effectively, Retailers or Manufacturers should adopt a data-driven approach and leverage insights from Share of Space comparisons to Market Share and Share of Assortment.
For instances where Share of Space exceeds Market Share or Share of Assortment, Retailers may consider reallocating space to high-performing products or categories to maximize sales potential. This could involve revising product assortment strategies, adjusting shelf layouts, or implementing promotional activities to enhance visibility and customer engagement.
In cases where Share of Space is less than Market Share or Share of Assortment, Retailers should focus on improving product availability, replenishing stock levels, and enhancing on-shelf visibility to minimize out-of-stock issues and capitalize on sales opportunities. Furthermore, Retailers can utilize customer feedback, sales data, and market trends to continuously refine their Share of Space optimization strategies and ensure alignment with consumer preferences and purchasing behaviors.
• Market Share
• Share of Assortment
• Brand Effectiveness
• Category Management Process