🎓 Definition
Share of Assortment is the number of SKUs of a Brand or in a Category compared to the total number of SKUs of a Brand or in a Category in the respective Category.
🧪 Example of Share of Assortment
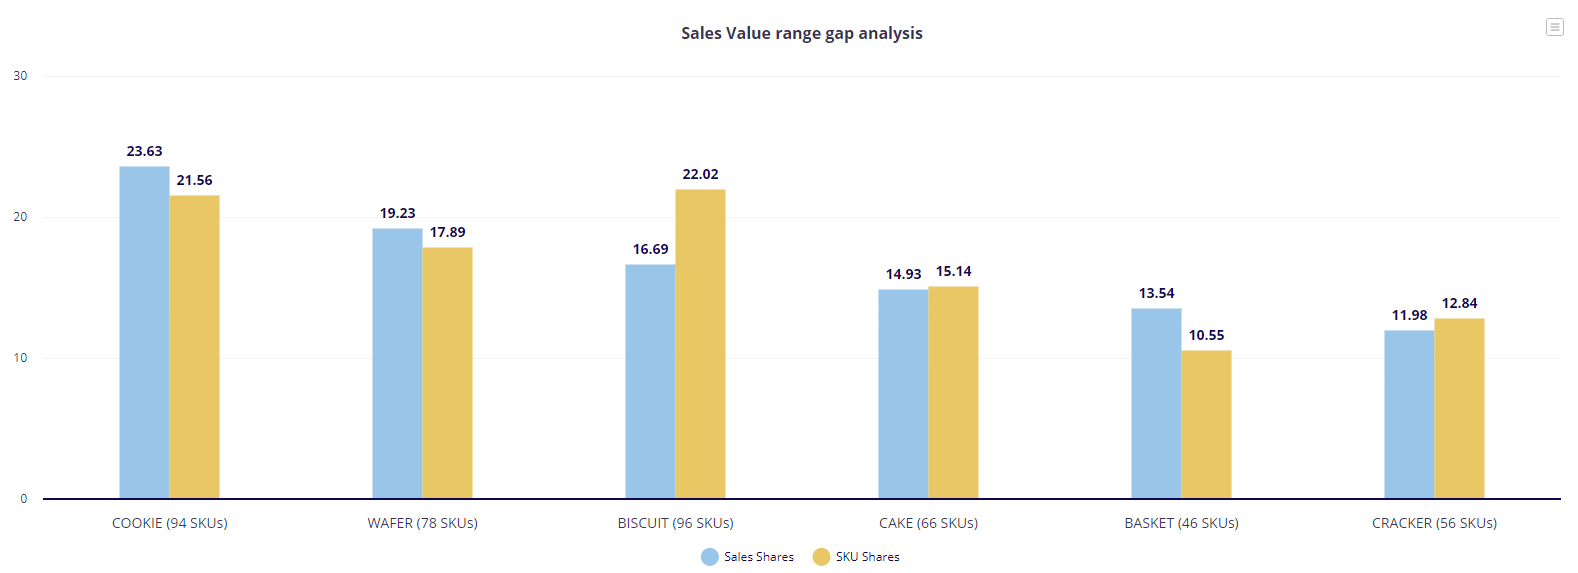
Category Example: Confectionary Category has a total number of 436 SKUs. Within the Confectionary there are 6 Sub-Categories, Cookies, Wafers, Biscuits, Cake, Baskets, and Crackers.
- Cookies 94 SKUs, Share of Assortment = 22%
- Wafer 78 SKUs, Share of Assortment = 22%
- Biscuits 96 SKUs, Share of Assortment = 30%
- Cake 66 SKUs, Share of Assortment = 15%
- Baskets 46 SKUs, Share of Assortment = 11%
- Crackers 56 SKUs, Share of Assortment = 13%
Brand example: if a Retailer has a total of 94 SKUs in the Cookies Sub-Category and 30 of those SKUs belong to Brand A, the Brand has a Share of Assortment of 32%. If the retailer carries 50 SKUs from Brand B, Brand B has a Share of Assortment of 53%.
❓What is Share of Assortment used for
Analyzing the share of assortment allows Retailers to optimize assortment and its space allocation also called Share of Space.
For Category management: Retailers can use the share of assortment to manage their product categories more effectively. By analyzing the share of assortment for different categories, retailers can identify which categories are performing well and which ones need improvement. They can adjust their product mix to optimize sales and meet customer demand.
For Sub-Categories effectiveness: Share of assortment helps retailers to improve Assortment effectiveness to ensure the numbers of SKUs allocated to a Sub-Category delivered a similar Share of Sales.
For Brand effectiveness: Share of assortment helps Retailers to measure the Brands effectiveness, Retailer will follow closely if the number of SKUs allocated to a Brand within a Category or Sub-Category (Share of Assortment) is close to the Brand Share of Sales also called Market Share.
By comparing Share of Assortment with Share of Sales, Retailers can gain additional insights Brand effectiveness:
- Share of Assortment is higher than Share of Sales = Retailers might want to reduce the number of SKUs for a Brand, to select better SKUs or activate SKUs through promotion or activities.
- Share of Assortment is lower than Share of Sales = It may indicate that the Retailer is missing out on sales opportunities by not offering enough products in that Category or Sub-category.
How is Share of Assortment calculated?
Share of Assortment is calculated by dividing the number of SKUs of a specific Brand or in a particular Category or Sub-Category by the total number of SKUs in that respective Category or Sub-Category, and then multiplying the result by 100 to get a percentage. For example, if there are 30 SKUs of Brand A in a Cookies Sub-Category out of a total of 94 SKUs, the Share of Assortment for Brand A would be (30/94) * 100 = 31.91%.
Are there any industry benchmarks or recommended targets for Share of Assortment that retailers should aim for to optimize sales and assortment effectiveness?
While specific industry benchmarks for Share of Assortment may vary based on the category and market dynamics, retailers generally aim to align their Share of Assortment with Share of Sales to optimize assortment effectiveness. Ideally, retailers should regularly analyze and compare their Share of Assortment and Share of Sales data to identify any discrepancies and make necessary adjustments to their product mix and assortment strategies.
How frequently should retailers re-evaluate and adjust their assortment based on Share of Assortment and Share of Sales data? Is there a recommended timeframe or best practice for this analysis and optimization process?
Retailers should ideally re-evaluate and adjust their assortment based on Share of Assortment and Share of Sales data regularly, such as on a quarterly or semi-annual basis, to ensure they are meeting customer demand and maximizing sales opportunities. However, the frequency of analysis and adjustments may vary depending on the category, market trends, and business objectives. It is essential for retailers to establish a consistent and structured approach to assortment optimization to remain competitive and responsive to market changes.
🖥️ Make it happen in Ariane
How to access Share of Assortment in Ariane: 3 Simple Steps
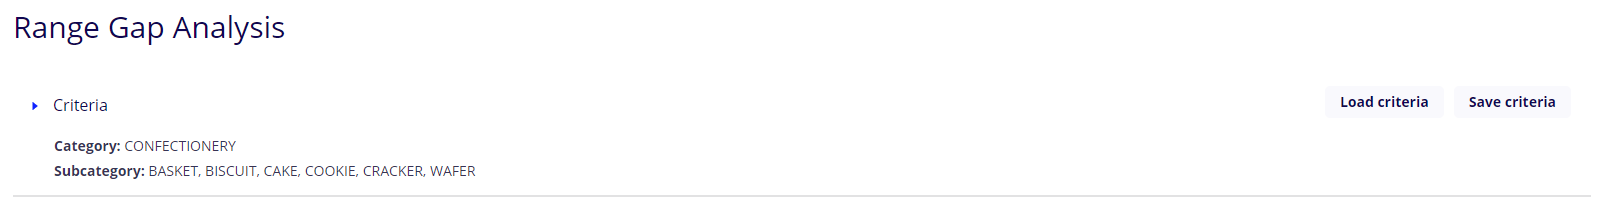
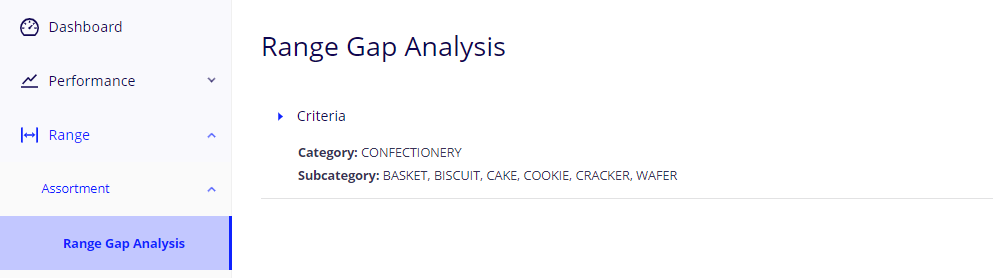
Step 1: Select the Range Gap Analysis Menu in the Promotion Menu Bar.
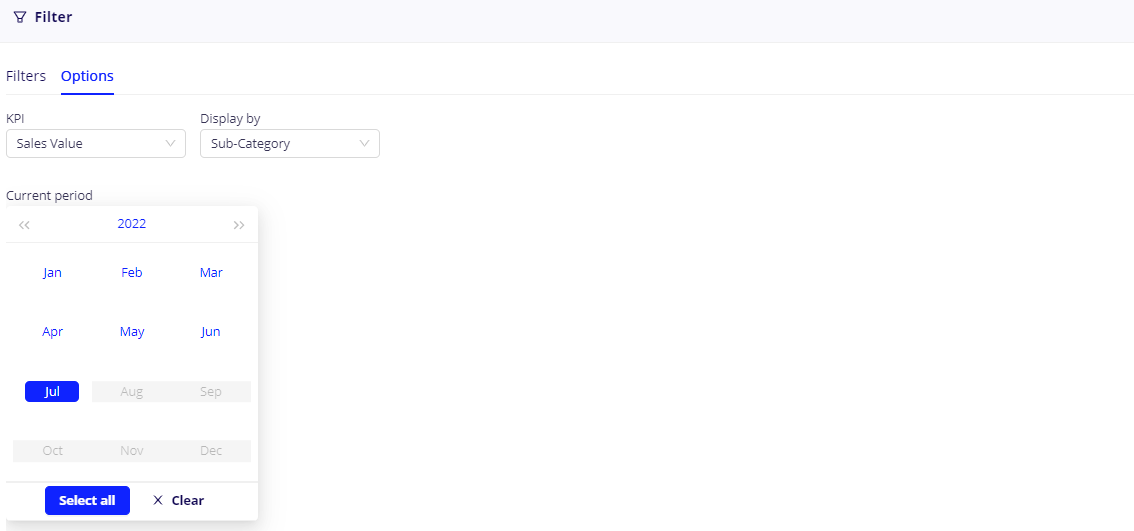
Step 2: Select Option in the Filter Menu and choose the KPI and hierarchy level you want to measure.

Step 3: Select the period you want to measure.
And here it is.