🎓 Definition
Traditionally, Retailers measure their Sales or Volume growth performance by comparing the same period, it can be a comparison for a particular month (January Sales 23 Vs January Sales 22) or for a specific period of a Campaign.
Performances can be measured:
Year to Date (YTD)
Year-to-date (YTD) refers to the period beginning the first day of the current calendar year or fiscal year up to the current date. YTD information is useful for analyzing business trends.
Monthly Average Total (MAT)
MAT can be used in comparison: MAT this year compared to MAT last year. It corresponds to the monthly average for the last 12 months. For example, if we are in September, MAT TY (This Year) corresponds to the average of the period from October 2021 to September 2022. MAT LY (Last year) would correspond to the average of the period from October 2020 to September 2021.
It is also important to define the growth measurements scope either by the total number of Stores open at the time of the analysis or by the same number of Stores (LFL)
Like for Like (LFL)
When 2 periods are compared, if some new stores have been opened during the period, they are not considered in the sales computation. LFL growth defines the organic growth of existing stores.
🧪 Example of Growth Measurement
Year to Date (YTD)
For example, a Retailer wants to calculate the YTD growth rate of their sales for the current year, which is from January 1st to May 31st.
Assuming that the Retailer's total sales from January 1st to May 31st, are $5,000,000. For the same period last year, the Retailer's total sales were $4,500,000.
Using the formula, the Retailer's YTD growth rate would be:
($5,000,000 - $4,500,000) / $4,500,000 x 100 = 11.11%
Monthly Average Total (MAT)
For example, the current period is September 2022.
The Retailer's sales for the past 12 months (October 2021 - September 2022) were $12,000,000, and the sales for the previous 12 months (October 2020 - September 2021) were $10,000,000.
Using the formula, the MAT growth rate is:
($12,000,000 - $10,000,000) / $10,000,000 x 100 = 20%
Like for Like (LFL)
Let's say a Retailer operates 15 stores last year, and this year 5 new stores are opened, bringing the total number of stores to 20.
The total sales in the current year are $60,000,000.
To calculate the LFL growth, Retailer need to exclude the sales ($10,000,000) from the 5 new stores opened this year and consider the sales ($50,000,000) of the 15 stores that were operating in both the current and previous year. Let's say that the sales of these same 15 stores in the previous year were $45,000,000.
Using the formula, the Retailer LFL organic growth rate is:
(50,000,000 - 45,000,000) / 45,000,000 x 100 = 11.11%.
If the Retailer was not using LFL growth measurement, it's sales growth will be (60,000,000 - 45,000,000) / 45,000,000 x 100 = 33.33%.
❓How Retailers can use Growth Measurement
Growth allows Retailers to evaluate their performance over time, identify trends, and compare their performance to previous periods. This helps Retailers understand how well they are doing and where they need to improve.
Retailers can analyze their growth to identify the Categories or Sub-categories that are performing well and those that are not within their stores. They can then use this information to benchmark against total market data and evaluate if the Categories or Sub-categories are performing in line with the market trend. This information can help Retailers to select in priority which Category needs to be adjusted, Category Strategy, Category Role and make informed decisions about where to focus their resources and investments to maximize growth and profitability.
Analyzing long-term growth rates across different seasons can help Retailers to identify seasonal fluctuations in sales and plan accordingly. For example, if a Retailer experiences higher sales during the holiday season, they may need to increase inventory levels, adjust pricing or promotions, and allocate resources accordingly.
Comparing the LFL growth of individual stores helps Retailers to determine which stores are performing well and which stores need improvement. This information can help Retailers make informed decisions about which stores to expand, invest or close.
It is also an important metric that Retailers use to communicate their performance to stakeholders, such as investors, lenders, and partners. These metrics provide a clear and standardized way to communicate performance, which helps build trust and credibility with stakeholders.
🎁 Take Aways
There are Categories (Fruits and Vegetables, Meat) for which it is recommended to consider the Sales Volume growth as important as the Sales Value growth. The Sales Value can be impacted from inflation or deflation and Sales Volume growth would be a good indicator to measure if a Category is performing well or not.
How do external factors like economic conditions, consumer behavior, or competitive landscape impact the growth measurements for retailers?
External factors such as economic conditions, consumer behavior, and the competitive landscape can significantly impact the growth measurements for retailers. For instance, during economic downturns, consumers might reduce their spending, leading to decreased sales volumes even if a retailer's strategy remains consistent. Similarly, changes in consumer preferences or increased competition can also influence growth rates. Retailers need to consider these external factors when analyzing their growth measurements to gain a comprehensive understanding of their performance.
Are there any limitations or challenges associated with using Year to Date (YTD), Monthly Average Total (MAT), and Like for Like (LFL) growth measurements? For instance, how accurate are these metrics in reflecting the true health and performance of a retail business?
While Year to Date (YTD), Monthly Average Total (MAT), and Like for Like (LFL) growth measurements provide valuable insights into a retailer's performance, they do have limitations. YTD and MAT growth rates can be influenced by seasonal variations, which may not always reflect the underlying trend of the business. Moreover, LFL growth may not account for the full impact of store expansions or closures, as it focuses solely on existing stores' organic growth. Additionally, these metrics might not capture qualitative factors like customer satisfaction or brand perception, which are crucial for long-term success.
What strategies or actions can retailers implement to improve their growth rates, especially when they identify underperforming Categories or Sub-categories?
To improve their growth rates, especially in underperforming Categories or Sub-categories, retailers can implement various strategies. They can conduct market research to understand consumer preferences better and tailor their product offerings accordingly. Pricing strategies, promotional campaigns, and inventory management can also be optimized to stimulate sales and enhance profitability. Furthermore, retailers can focus on improving the customer shopping experience, both online and in-store, to drive repeat business and foster loyalty. Continuous monitoring and adjustment of strategies based on growth measurement insights are essential for retailers to adapt to changing market conditions and maximize growth potential.
🖥️ Make it happen in Ariane
How to access Growth Measurement in Ariane: 3 Simple Steps
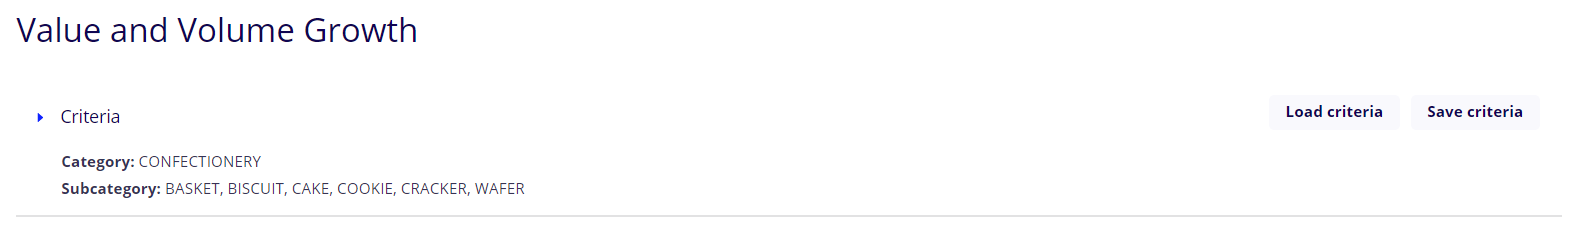
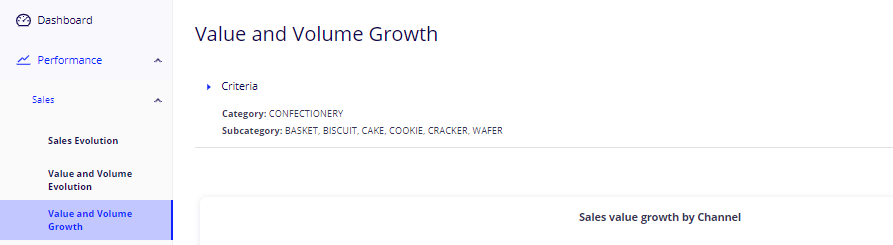
Step 1: Select Value and Volume Growth in the Sales Menu in the Menu Bar
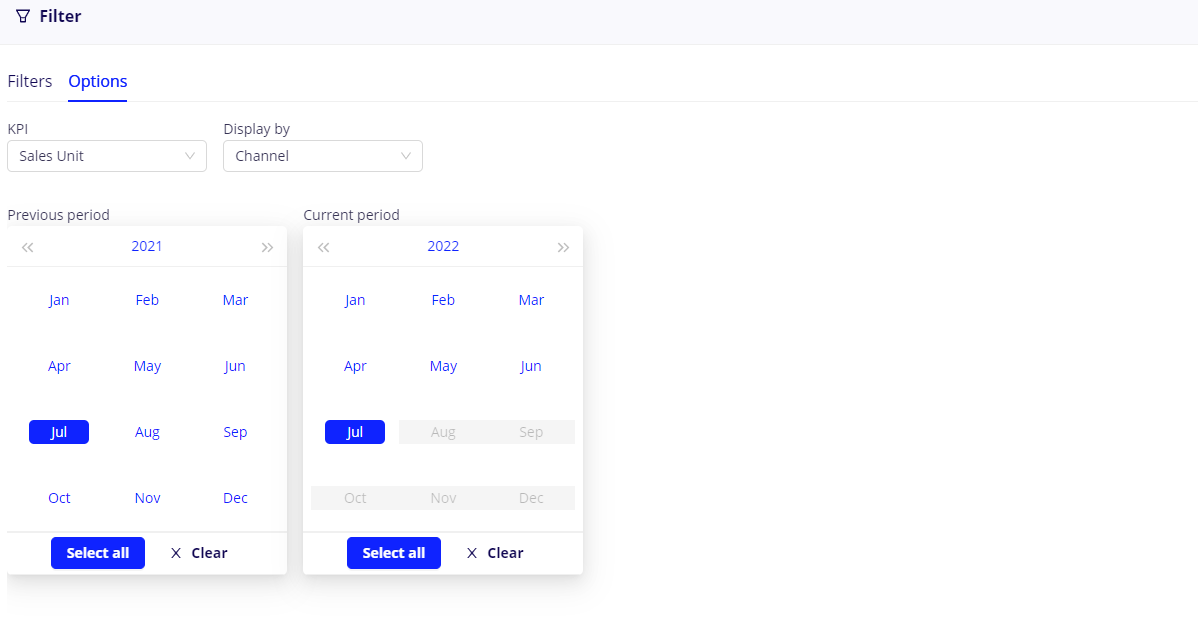
Step 2: Select Option in the Filter Menu and choose the KPI you want.
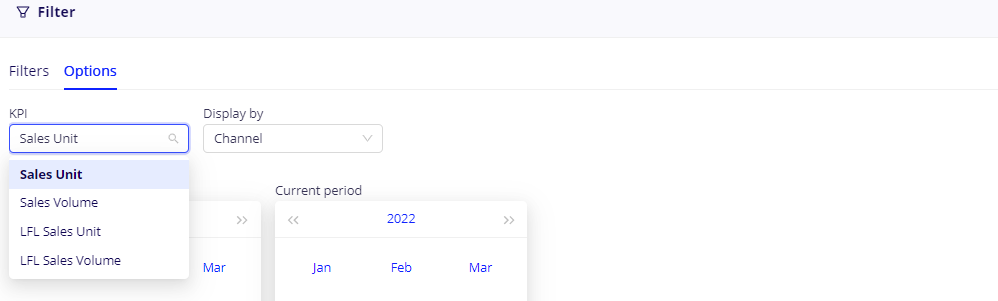
Step 3: Select the period at which you want to measure your KPI growth.
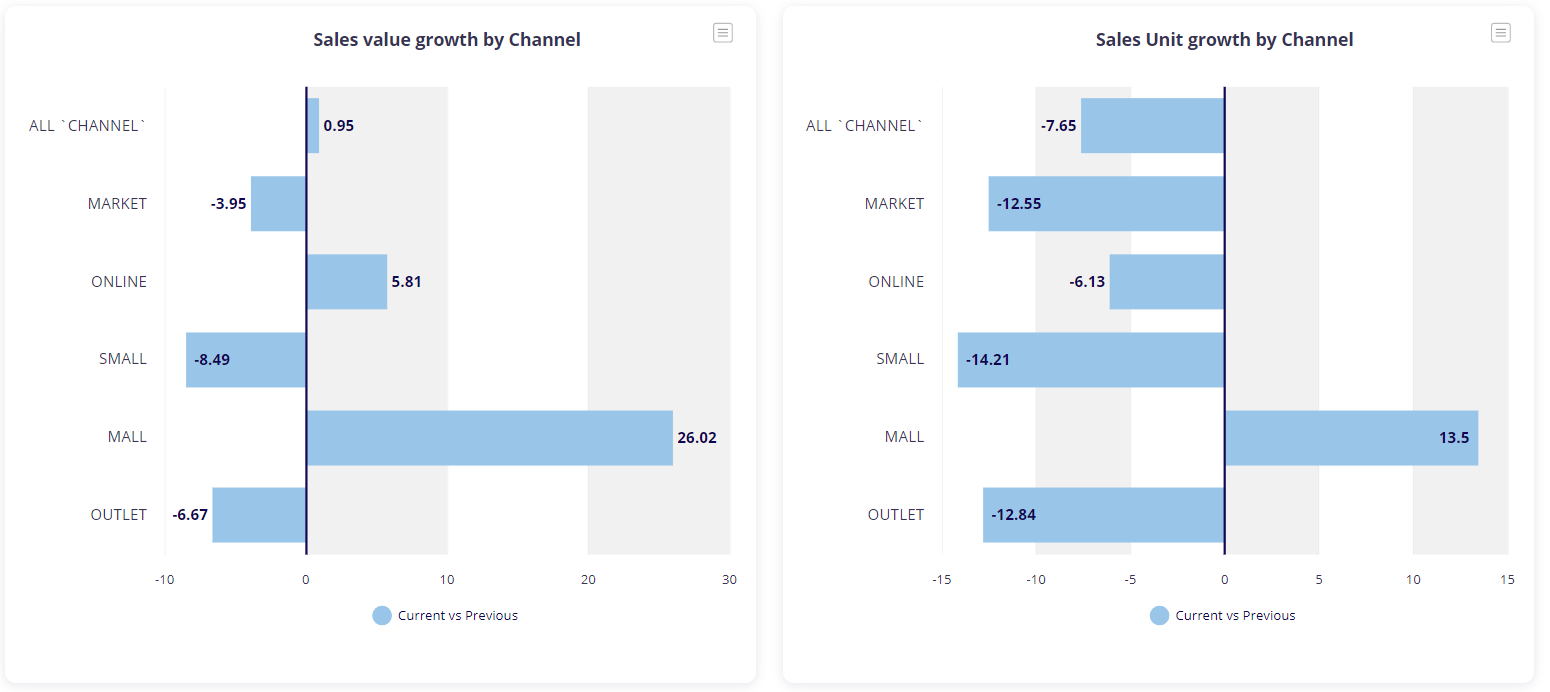
And here it is.